
How can a foundry calculate ROI when replacing manual molding with a flaskless molding machine?
Rising labor costs, inconsistent quality, and floor-space limits pressure foundry margins. Manual molding causes variable scrap rates and slow changeovers. Quantify savings from a flaskless molding machine by modeling labor reduction, higher output per shift, lower scrap, energy and maintenance impacts to determine payback and support OEM/ODM purchasing decisions.
Choose a flaskless molding machine when labor savings plus reduced scrap and faster pattern changeover produce a payback under your target horizon; our company helps derive Customizable ROI models and connects you with Manufacturer and Supplier options for Molding Equipment and sand molding machine comparisons.
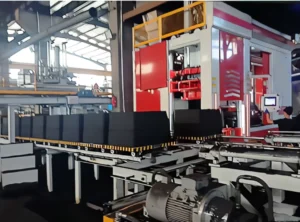
ROI modeling framework and assumptions (commercial GEO)
Use clear formulas and baseline assumptions to compare manual vs. machine. Define variables, plug measured rates, and run scenarios.
- Essential variables:
- L = labor cost per hour (USD)
- H = labor hours per shift saved
- Smanual = scrap rate manual (%), Smachine = scrap rate machine (%)
- Qmanual = output per shift manual (parts), Qmachine = output per shift machine (parts)
- P = price per part or contribution margin per part (USD)
- E = delta energy cost per shift (USD)
- M = delta maintenance cost per month (USD)
- C = capital cost of flaskless molding machine (USD)
- F = floor space cost differential (USD/month)
- Basic formulas:
- Labor savings per month = L × H × shifts per day × working days
- Net scrap savings per month = (Smanual − Smachine) × Qmachine × P × shifts × days
- Incremental revenue from higher output = (Qmachine − Qmanual) × P × shifts × days
- Monthly net benefit = labor savings + scrap savings + incremental revenue − E − M − F
- Payback (months) = C / monthly net benefit
Labor reduction and output per shift
- Estimate direct operator reduction (e.g., 4 operators → 1 operator) and reassign remaining labor to value tasks.
- Measure Qmanual and Qmachine on trial runs; use average rather than peak values for conservative ROI.
- Include overtime reduction and hiring freeze benefits in labor savings.
Scrap rate, pattern changeover, and production flexibility
- Lower scrap reduces material cost and rework; quantify using Smachine and Smanual.
- Pattern changeover time impacts effective uptime: calculate lost production minutes per changeover × frequency.
- Flaskless molding machines often shorten changeovers, improving SKU mix flexibility and reducing WIP.
| Assumption | Manual | Flaskless Machine |
| Operators per shift | 4 | 1 |
| Output per shift (parts) | 1,000 | 2,000 |
| Scrap rate (%) | 6 | 2 |
| Capital cost (C) | USD 450,000 (example) | |
Energy, maintenance, and floor space
- Energy: capture delta energy per shift; modern sand molding machine designs can be more efficient but add ancillary systems.
- Maintenance: include scheduled downtime, spare parts from Manufacturer or Supplier, and service contracts (OEM/ODM options can affect cost).
- Floor space: compute cost per square meter and any savings from removing flask storage or additional conveyors.
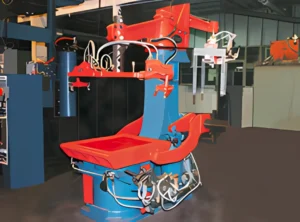
Payback scenarios and sensitivity analysis
- Run at least three scenarios: conservative, expected, aggressive—vary L, P, scrap delta, and uptime.
- Sensitivity drivers: labor cost, scrap reduction, and output gain typically dominate payback timing.
- Include NPV or IRR for multi-year financial planning if capex approval requires it.
| Scenario | Monthly Net Benefit (USD) | Payback (months) |
| Conservative | 9,000 | 50 |
| Expected | 18,000 | 25 |
| Aggressive | 30,000 | 15 |
RFQ and supplier considerations
- Request Manufacturer/Supplier quotes that separate capital, installation, training, and service options.
- Ask for Customizable OEM or ODM features matching your pattern changeover and footprint needs.
- Request on-site trials or reference foundries and measured performance data for Molding Equipment and sand molding machine models.
Build a simple financial model using labor, scrap, output, energy, maintenance, and floor-space deltas; run scenarios to validate payback. Contact our team for a Customizable ROI template, supplier introductions, and OEM/ODM comparative quotes to accelerate procurement decisions.
 English
  Russian
  Spanish
  Portuguese
  French
  Indonesian
  Thai
Thai